Table of Contents
- How Role-Based Dashboards Improve Business Decision-Making
- What Is a Role-Based Dashboard?
- Why Businesses Need Role-Based Dashboards
- 1. Provides Relevant Information
- 2. Helps Managers Make Faster Decisions
- 3. Reduces Information Overload
- 4. Improves Data Visibility
- 5. Supports Better Performance Tracking
- 6. Improves Employee Productivity
- 7. Strengthens Access Control
- 8. Helps Protect Sensitive Business Data
- 9. Provides Real-Time Business Insights
- 10. Makes Alerts More Useful
- Inventory Manager
- Finance Manager
- Sales Manager
- Administrator
- Examples of Role-Based Dashboards
- Retail Business
- Restaurant Business
- Employee Management System
- Important Components of a Good Role-Based Dashboard
- Key Performance Indicators
- Charts and Graphs
- Tables
- Alerts
- Filters
- Search
- Quick Actions
- Responsive Design
- Best Practices for Designing Role-Based Dashboards
- Keep the Interface Simple
- Prioritize Important Metrics
- Use Consistent Navigation
- Combine Summary and Detail
- Provide Appropriate Permissions
- Make Dashboards Customizable
- Monitor Dashboard Performance
- Common Mistakes to Avoid
- Role-Based Dashboards and Business Growth
- Conclusion
How Role-Based Dashboards Improve Business Decision-Making
Modern businesses generate large amounts of information every day. Sales, inventory, customer activity, employee performance, finances, and operational data can all contribute to important business decisions. However, simply having access to data does not guarantee better decisions. Employees need to see the right information at the right time.
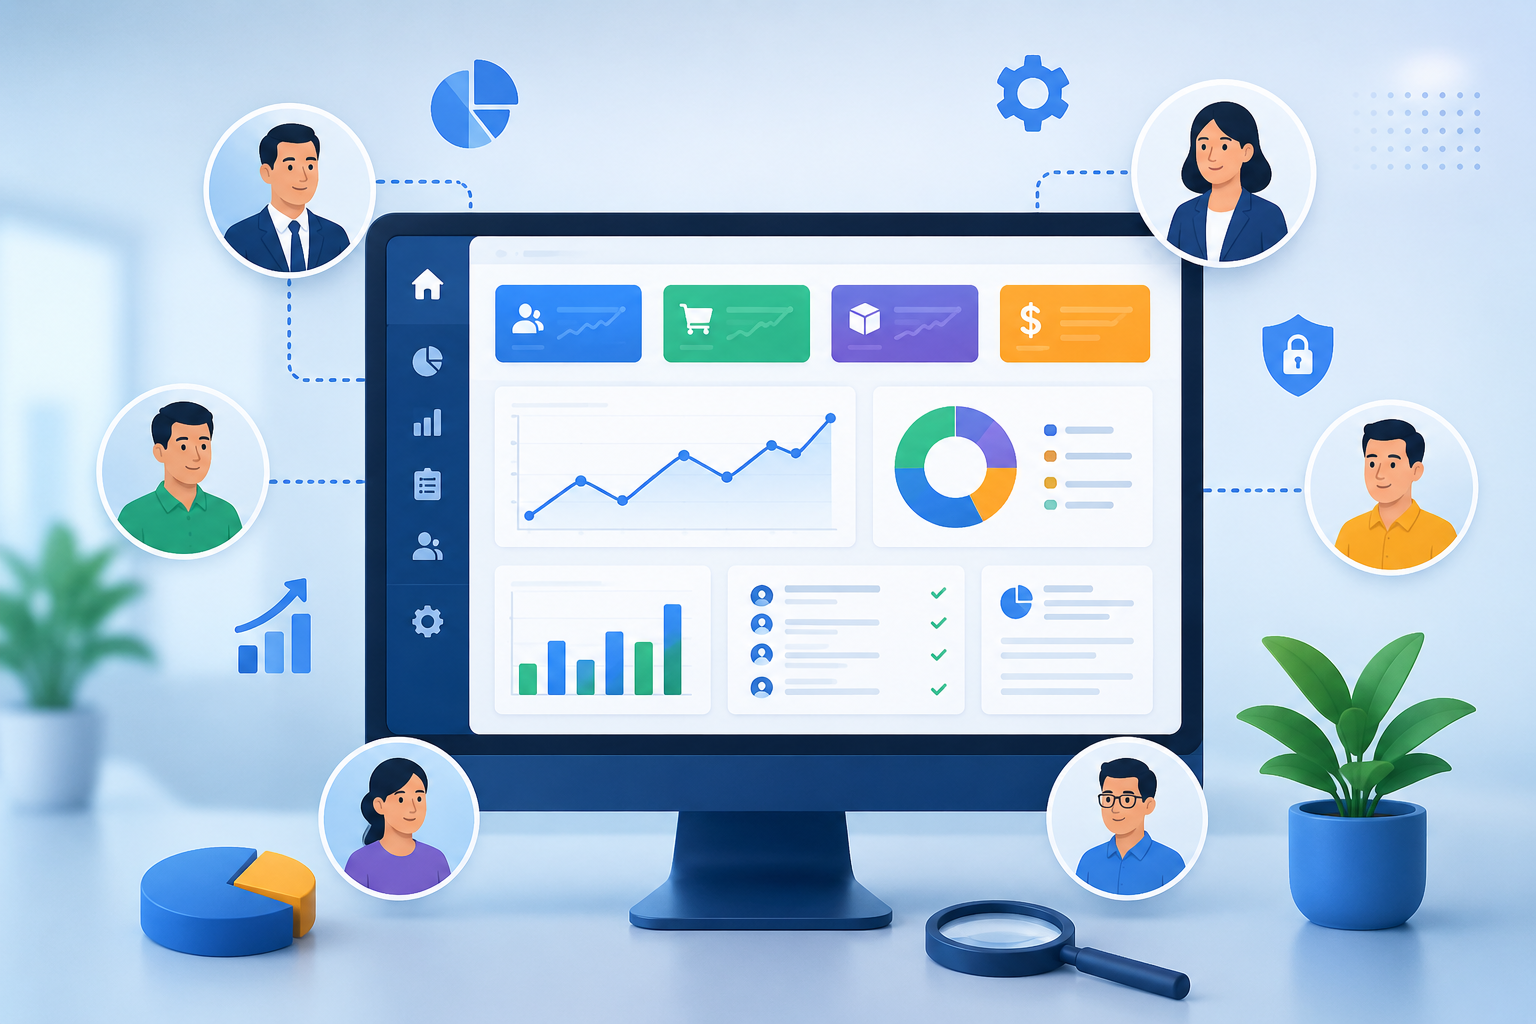
A role-based dashboard organizes information according to a user's responsibilities and access permissions. Instead of giving every employee the same dashboard, the system displays relevant metrics, reports, alerts, and actions based on the user's role.
For growing businesses, role-based dashboards can improve productivity, data visibility, security, and decision-making.
What Is a Role-Based Dashboard?
A role-based dashboard is a software interface that provides different information and functionality to users based on their assigned roles.
For example:
- Business Owner: Revenue, sales trends, expenses, overall performance
- Manager: Team performance, pending tasks, sales targets
- Sales Staff: Leads, customers, orders, follow-ups
- Inventory Staff: Stock levels, low-stock products, purchase orders
- Finance Staff: Payments, invoices, expenses, financial reports
- Administrator: Users, permissions, system activity, configuration
Each user gets a dashboard designed around their responsibilities.
Why Businesses Need Role-Based Dashboards
Without role-based dashboards, employees may have to search through large amounts of information to find what they need. This can waste time and make important information harder to identify.
A role-based approach can provide a more focused experience by showing users the information that is most relevant to their daily work.
For example, a warehouse employee may not need detailed marketing analytics, while a marketing manager may not need daily inventory information.
1. Provides Relevant Information
One of the biggest advantages of role-based dashboards is relevance.
Instead of displaying dozens of unrelated metrics, a dashboard can prioritize information based on the user's responsibilities.
A sales manager might immediately see:
- Today's sales
- Monthly revenue
- New leads
- Pending follow-ups
- Sales targets
- Top-performing employees
This can make it easier to identify important information without searching through multiple sections of an application.
2. Helps Managers Make Faster Decisions
Business decisions often depend on timely information.
A manager who can quickly see sales performance, inventory levels, pending orders, or employee activity can respond to problems sooner.
For example, if a dashboard shows that a popular product is approaching its minimum stock level, a manager can initiate a purchase order before the product becomes unavailable.
The dashboard therefore becomes more than a reporting tool—it becomes a decision-support tool.
3. Reduces Information Overload
Showing too much information can make dashboards difficult to use.
A role-based dashboard can reduce unnecessary information by displaying only the metrics and functions relevant to a particular user.
For example:
Sales Dashboard
- Leads
- Sales
- Customers
- Follow-ups
- Conversion rate
Inventory Dashboard
- Current stock
- Low-stock items
- Stock movement
- Suppliers
- Purchase orders
This focused approach can make business software easier to understand.
4. Improves Data Visibility
Businesses often store information across different areas of an application.
A well-designed dashboard can bring important information together in one place.
For example, a business owner could see:
Revenue + Sales + Orders + Customers + Expenses
Instead of opening multiple screens, the owner can review key indicators from a centralized dashboard.
5. Supports Better Performance Tracking
Role-based dashboards can help organizations track performance according to specific responsibilities.
For example, a sales manager may monitor:
- Number of leads
- Number of conversions
- Revenue generated
- Target achievement
- Average order value
Managers can use these indicators to identify areas that are performing well and areas that may require attention.
6. Improves Employee Productivity
Employees often spend considerable time searching for information or navigating through unnecessary system features.
A role-specific dashboard can place frequently used functions directly in front of them.
For example, an employee's dashboard might contain:
- Today's tasks
- Pending approvals
- Recent activities
- Notifications
- Quick actions
This can reduce unnecessary navigation and help employees focus on their primary responsibilities.
7. Strengthens Access Control
Role-based dashboards can work together with role-based access control (RBAC).
RBAC allows organizations to assign permissions based on job roles rather than managing access individually for every user. Users can then receive access to the information and functions required for their responsibilities.
For example:
Administrator
→ Full system access
Manager
→ Reports + Team Management
Sales Employee
→ Customers + Sales
Inventory Employee
→ Products + Stock
This approach can help businesses limit unnecessary access to sensitive information.
8. Helps Protect Sensitive Business Data
Not every employee should have access to every type of information.
Financial records, employee information, customer data, and administrative settings may require restricted access.
A role-based dashboard can help ensure that sensitive information is only presented to authorized users.
For example, an employee working in sales may be able to view customer orders but not access company-wide financial reports.
9. Provides Real-Time Business Insights
Modern dashboards can connect with business databases and other systems to display frequently updated information.
Depending on the application, dashboards may show:
- Current sales
- New orders
- Inventory levels
- Customer activity
- Pending payments
- Employee activity
- System alerts
Access to updated information can help managers respond to changing business conditions more quickly.
10. Makes Alerts More Useful
Dashboards can display alerts based on a user's responsibilities.
For example:
Inventory Manager
Low Stock: 12 products
Finance Manager
8 invoices pending payment
Sales Manager
15 leads require follow-up
Administrator
3 new user-access requests
Role-specific alerts can help prevent important notifications from getting lost among irrelevant information.
Examples of Role-Based Dashboards
Retail Business
A retail application could provide:
Owner Dashboard
- Total sales
- Revenue
- Expenses
- Profit overview
- Branch performance
Store Manager Dashboard
- Daily sales
- Staff performance
- Stock alerts
- Orders
- Customer activity
Cashier Dashboard
- Billing
- Product search
- Transactions
- Returns
Restaurant Business
A restaurant management system could include:
Owner
- Revenue
- Sales
- Expenses
- Branch performance
Manager
- Reservations
- Staff
- Orders
- Inventory
- Daily sales
Kitchen Staff
- New orders
- Order status
- Pending items
- Completed orders
Cashier
- Bills
- Payments
- Refunds
- Receipts
Each dashboard provides the functionality needed by the respective user.
Employee Management System
An employee application could provide:
HR Dashboard
- Employee count
- Attendance
- Leave requests
- Recruitment
- Employee records
Manager Dashboard
- Team attendance
- Tasks
- Leave approvals
- Performance
Employee Dashboard
- Personal profile
- Attendance
- Leave balance
- Tasks
- Announcements
Important Components of a Good Role-Based Dashboard
A useful dashboard should provide more than attractive charts.
Key Performance Indicators
Important metrics should be displayed prominently.
Charts and Graphs
Visual representations can make trends easier to understand.
Tables
Detailed records can support deeper analysis.
Alerts
Important issues should be highlighted clearly.
Filters
Users should be able to filter information by dates, departments, branches, products, or other relevant criteria.
Search
Search functionality can help users quickly find specific records.
Quick Actions
Frequently used functions should be easily accessible.
Responsive Design
Dashboards should work effectively on desktops, tablets, and mobile devices when required.
Best Practices for Designing Role-Based Dashboards
Keep the Interface Simple
Avoid filling the dashboard with unnecessary charts and information.
Prioritize Important Metrics
The most important information should appear first.
Use Consistent Navigation
Users should be able to understand where to find different functions.
Combine Summary and Detail
Show high-level information first and allow users to open detailed records when necessary.
Provide Appropriate Permissions
Dashboard visibility should match the user's assigned role and responsibilities.
Make Dashboards Customizable
Where appropriate, users can be allowed to personalize widgets, filters, or layouts without bypassing security controls.
Monitor Dashboard Performance
Large datasets and poorly optimized queries can make dashboards slow. Database optimization, caching, pagination, and efficient API design can help improve performance.
Common Mistakes to Avoid
Businesses should avoid creating dashboards that:
- Display too many metrics
- Use confusing charts
- Show irrelevant information
- Provide excessive access
- Lack useful filters
- Hide important alerts
- Use outdated information without clear timestamps
- Have slow loading times
A dashboard should simplify decision-making rather than create another layer of complexity.
Role-Based Dashboards and Business Growth
As businesses expand, they often add more employees, departments, branches, products, and customers.
A role-based dashboard can help organize this increasing complexity.
For example, a multi-branch business might provide:
Head Office
→ Overall company performance
Regional Manager
→ Regional performance
Branch Manager
→ Individual branch performance
Employee
→ Personal responsibilities
This structure allows each level of the organization to focus on the information it needs.
Conclusion
Role-based dashboards can transform business software from a simple data-storage system into a more effective decision-support platform.
By providing users with relevant information, appropriate access, performance indicators, alerts, reports, and quick actions, businesses can help employees work more efficiently and managers make better-informed decisions.
Whether it is a retail application, restaurant management system, CRM, inventory platform, HR system, or custom business application, role-based dashboards can make complex business information easier to understand and act upon.
The key is to design dashboards around real business roles and decisions, rather than simply filling the screen with as much data as possible. A well-designed role-based dashboard should help every user quickly answer one important question: