Table of Contents
- Why Real-Time Business Dashboards Matter for Better Decision-Making
- What Is a Real-Time Business Dashboard?
- Why Traditional Reports May Not Be Enough
- Faster Decision-Making
- Identifying Problems Earlier
- Improving Operational Visibility
- Supporting Data-Driven Decisions
- Monitoring KPIs Continuously
- Reducing Manual Reporting
- Improving Team Coordination
- Better Customer Service
- Improving Sales Management
- Inventory and Operations Monitoring
- Financial Monitoring
- Connecting Multiple Business Systems
- Real-Time Alerts and Notifications
- Real-Time Does Not Always Mean Every Second
- Designing an Effective Real-Time Dashboard
- Important KPIs
- Clear Visualizations
- Useful Alerts
- Filtering
- Simple Navigation
- Reliable Data
- Security and User Permissions
- Combining Real-Time Data with Historical Data
- How to Implement a Real-Time Dashboard
- Step 1: Identify Important Decisions
- Step 2: Select Key Metrics
- Step 3: Identify Data Sources
- Step 4: Connect the Systems
- Step 5: Build the Dashboard
- Step 6: Set Appropriate Refresh Rates
- Step 7: Add Permissions
- Step 8: Measure the Impact
- The Human Element Still Matters
- Conclusion
Why Real-Time Business Dashboards Matter for Better Decision-Making
Businesses generate new information every minute. Sales transactions are completed, customer inquiries arrive, employees update tasks, inventory changes, payments are processed, and marketing campaigns generate new results.
The challenge for modern businesses is no longer simply collecting this information. The challenge is getting the right information to decision-makers quickly enough to act on it.
Traditional reports often provide a snapshot of what happened earlier. A real-time business dashboard, by contrast, continuously updates important metrics as new information becomes available, giving managers a more current view of business operations.
What Is a Real-Time Business Dashboard?
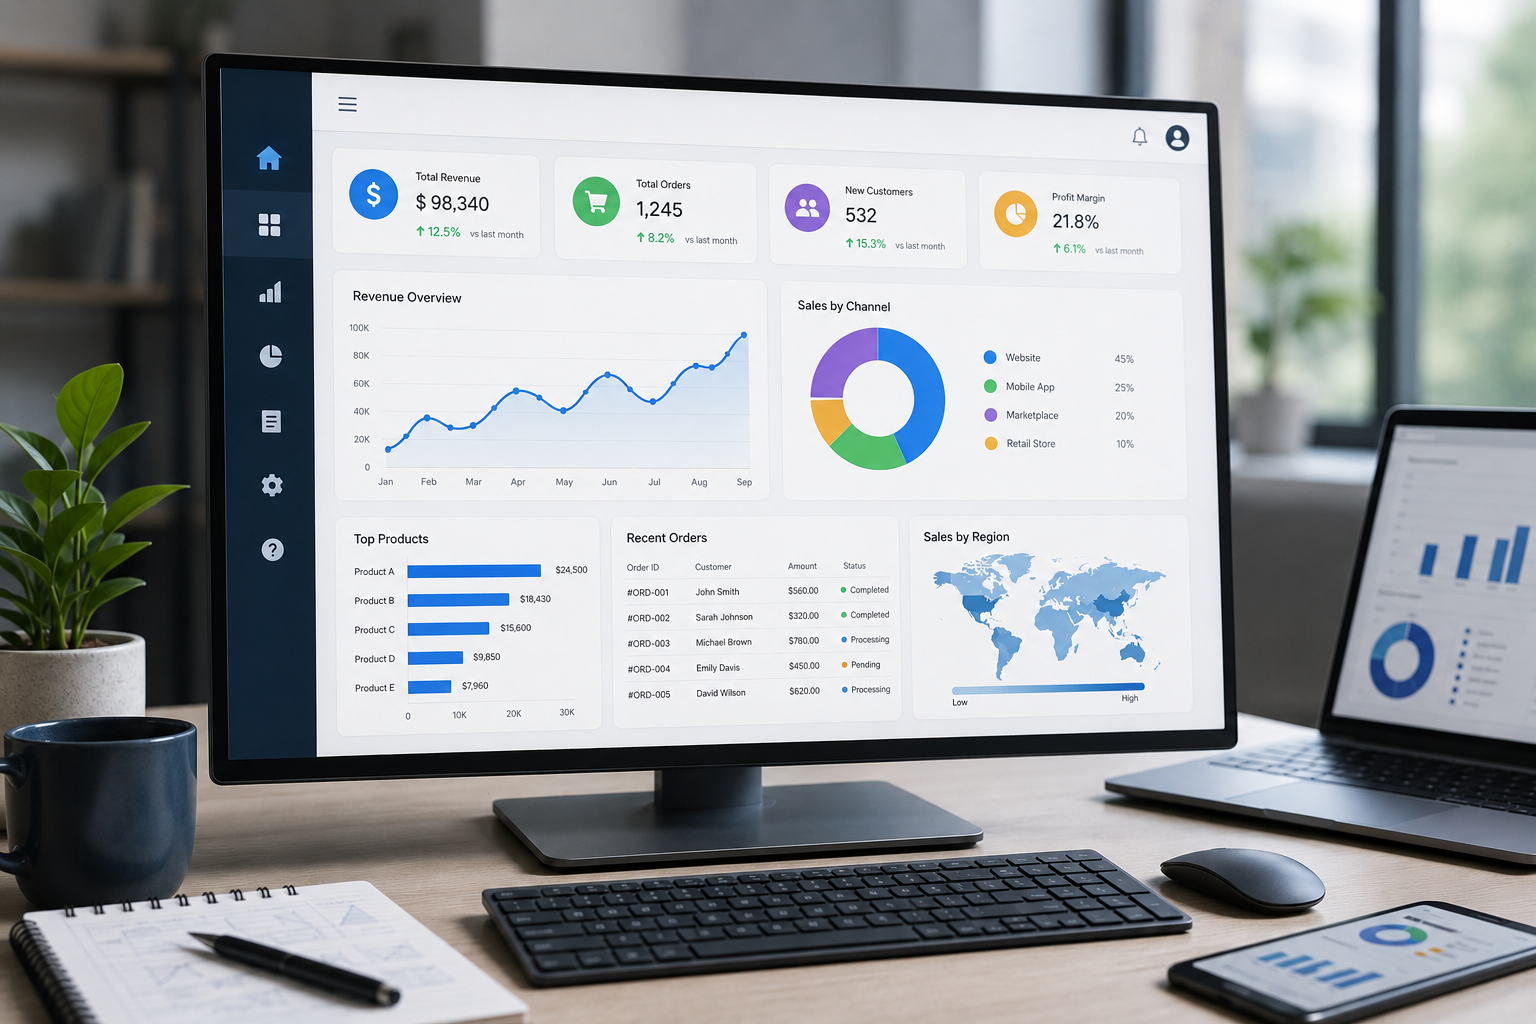
A real-time business dashboard is a digital interface that displays current business information through metrics, charts, graphs, tables, alerts, and other visual elements.
Instead of waiting for a daily, weekly, or monthly report, authorized users can monitor important business activities as they change.
A dashboard might display:
- Current sales
- New customers
- Pending orders
- Active projects
- Employee activities
- Website performance
- Inventory levels
- Financial indicators
- Customer support requests
- Marketing performance
The exact information depends on the organization's goals and operational requirements.
Why Traditional Reports May Not Be Enough
Traditional reports remain useful for historical analysis and long-term planning. However, they can become less useful when decisions need to be made quickly.
Imagine a company discovers through a weekly report that sales in one region have declined significantly. By the time management receives the report, several days may have passed.
With a real-time dashboard, management could potentially identify the decline much earlier and investigate the cause while there is still time to respond.
Real-time analytics is particularly valuable when the delay between an event and a response can affect business outcomes.
Faster Decision-Making
One of the biggest advantages of real-time dashboards is speed.
Managers do not always have time to collect information from different departments and prepare a report before making a decision.
A centralized dashboard can provide important information immediately.
For example, a sales manager could see:
Today's Sales: ₹4,85,000
New Leads: 74
Orders: 126
Conversion Rate: 8.4%
Pending Follow-Ups: 32
This gives the manager a quick understanding of current performance and helps identify areas requiring attention.
Identifying Problems Earlier
Small operational problems can become larger problems if they are not identified quickly.
A real-time dashboard can help businesses monitor changes and identify unusual activity.
For example:
- A sudden decline in sales
- Increasing customer complaints
- Low inventory
- Delayed projects
- Rising website errors
- Increasing service requests
- Unusual financial transactions
Early visibility gives teams more opportunity to investigate and respond before the problem becomes more difficult to manage.
Live dashboards are particularly useful for operational monitoring because they can highlight changes while processes are still underway.
Improving Operational Visibility
Managers cannot effectively manage what they cannot see.
In growing organizations, information may be distributed across multiple departments and systems.
A real-time dashboard can bring selected information together and provide a centralized operational view.
For example, a business dashboard could show:
Sales: On Target
Projects: 38 Active
Customer Requests: 21 Pending
Inventory: 86% Available
Payments: ₹12.4 Lakh
Tasks: 14 Overdue
This allows management to understand the current state of the business without reviewing multiple separate reports.
Supporting Data-Driven Decisions
Good business decisions should be supported by reliable information.
Instead of relying entirely on assumptions or outdated reports, managers can use current data to understand what is happening.
For example, if a marketing campaign is generating fewer conversions than expected, a real-time dashboard can help identify the change and allow the marketing team to review the campaign sooner.
The dashboard does not replace human judgment. It provides better information for that judgment.
Monitoring KPIs Continuously
Key Performance Indicators help businesses measure progress toward specific objectives.
Common KPIs include:
- Revenue
- Sales growth
- Customer acquisition
- Conversion rate
- Profit margin
- Project completion
- Customer satisfaction
- Employee productivity
- Inventory turnover
A real-time dashboard can display these KPIs continuously instead of requiring employees to calculate them manually.
This makes it easier for management to identify positive or negative changes.
Reducing Manual Reporting
Preparing reports manually can consume significant employee time.
Employees may need to:
- Collect information from different systems.
- Export spreadsheets.
- Combine data.
- Calculate metrics.
- Create charts.
- Format the report.
- Send it to management.
A connected dashboard can automate much of this process.
When the underlying data is updated, the dashboard can update its visualizations and metrics accordingly.
This reduces repetitive reporting work and allows employees to spend more time analyzing information rather than preparing it.
Improving Team Coordination
Real-time dashboards are not only useful for senior management.
Different departments can use dashboards to coordinate their activities.
For example, a sales team can monitor new leads while the operations team tracks pending orders and customer support monitors open tickets.
When teams have access to relevant and current information, they can coordinate their actions more effectively.
Better Customer Service
Customers increasingly expect fast responses.
A business that can quickly identify customer issues has a better opportunity to resolve them before they become serious problems.
For example, a customer service dashboard could show:
- Open tickets
- Response times
- Pending requests
- Escalated complaints
- Completed requests
- Service-level performance
Managers can use this information to identify overloaded teams and allocate resources accordingly.
Real-time information can also help customer-facing employees provide more accurate updates to customers.
Improving Sales Management
Sales teams can benefit significantly from real-time dashboards.
A sales dashboard can monitor:
- New leads
- Active opportunities
- Sales pipeline
- Conversion rates
- Orders
- Revenue
- Follow-up activities
- Sales by employee
- Sales by location
If a particular product or region suddenly performs differently, management can identify the change and investigate it quickly.
This can help sales teams adjust their activities based on current performance rather than waiting for an end-of-month report.
Inventory and Operations Monitoring
Businesses that manage physical products need accurate information about inventory.
A real-time dashboard can help monitor:
- Current stock
- Low-stock items
- Incoming inventory
- Orders
- Product movement
- Warehouse activity
This can help businesses identify potential stock shortages earlier and make better purchasing or distribution decisions.
Real-time operational data is especially useful when inventory, logistics, or supply chain conditions can change quickly.
Financial Monitoring
Financial dashboards can provide management with a current view of important financial indicators.
Depending on the organization's systems, this could include:
- Revenue
- Expenses
- Outstanding payments
- Cash flow
- Budget utilization
- Department expenses
- Monthly performance
Real-time visibility can help management identify unusual financial activity or unexpected changes earlier.
However, financial dashboards should always use reliable source data and appropriate access controls.
Connecting Multiple Business Systems
A real-time dashboard becomes more valuable when it can receive information from multiple systems.
Possible data sources include:
- CRM platforms
- ERP systems
- Accounting software
- Payment gateways
- HR systems
- Inventory databases
- Marketing platforms
- Website analytics
- Customer support systems
APIs, database connections, and other integrations can allow information from these systems to appear within a centralized dashboard.
This reduces the need for managers to switch between multiple applications.
Real-Time Alerts and Notifications
Dashboards can become even more useful when combined with automated alerts.
For example, the system could notify an authorized user when:
- Sales fall below a target
- Inventory reaches a minimum level
- A task becomes overdue
- A payment fails
- A project passes its deadline
- Customer requests exceed a threshold
This changes the dashboard from a passive reporting tool into a more proactive management system.
Real-Time Does Not Always Mean Every Second
An important point is that every business does not need data updates every second.
For some businesses, a dashboard updated every few minutes may be sufficient. Others may only need hourly updates.
The appropriate update frequency depends on how quickly the underlying business situation changes and how quickly users need to respond. Real-time analytics can be unnecessary when delayed information does not materially affect a decision.
Businesses should therefore focus on useful and timely information, rather than simply pursuing the fastest possible refresh rate.
Designing an Effective Real-Time Dashboard
A dashboard should not display every available metric.
Too much information can make it harder to identify what actually matters.
An effective dashboard should focus on:
Important KPIs
Display metrics directly connected to business objectives.
Clear Visualizations
Use charts and graphs that make trends easy to understand.
Useful Alerts
Highlight exceptions and issues that require action.
Filtering
Allow users to view information by date, department, location, product, or other relevant criteria.
Simple Navigation
Users should be able to find important information quickly.
Reliable Data
The dashboard should be connected to trustworthy and properly maintained data sources.
Security and User Permissions
Real-time dashboards can contain sensitive business information.
Sales figures, employee information, customer records, financial data, and operational details should not necessarily be available to every employee.
Role-based access can ensure that users only see the information relevant to their responsibilities.
For example:
Administrator: Full system access
Manager: Department-level information
Sales Team: Sales and customer information
Finance Team: Financial records
Employee: Assigned tasks and relevant operational information
Security should be considered from the beginning rather than added after the dashboard has been deployed.
Combining Real-Time Data with Historical Data
Real-time information is valuable, but current numbers do not always tell the entire story.
A strong dashboard can combine current information with historical trends.
For example, instead of simply showing today's sales, a dashboard could compare:
Today → This Week → This Month → Previous Month → Previous Year
This helps management understand whether a current change is normal or unusual.
Combining current and historical information provides better context for decision-making.
How to Implement a Real-Time Dashboard
Businesses can start with a simple implementation process.
Step 1: Identify Important Decisions
Determine which business decisions require timely information.
Step 2: Select Key Metrics
Choose the KPIs that directly support those decisions.
Step 3: Identify Data Sources
Determine where the required information currently exists.
Step 4: Connect the Systems
Use APIs, databases, or integrations to bring relevant information together.
Step 5: Build the Dashboard
Create a clear interface with metrics, charts, filters, and alerts.
Step 6: Set Appropriate Refresh Rates
Choose an update frequency based on actual business requirements.
Step 7: Add Permissions
Ensure sensitive information is only available to authorized users.
Step 8: Measure the Impact
Monitor whether the dashboard actually reduces reporting time, improves response speed, or supports better decisions.
The Human Element Still Matters
Technology alone does not guarantee better decisions.
A dashboard can provide current information, but employees still need to understand what the information means and what action should follow.
Organizations should define:
- Which metrics matter
- What thresholds require action
- Who is responsible
- What actions should be taken
- When escalation is required
Real-time data creates the most value when employees have both the authority and the processes needed to act on it.
Conclusion
Real-time business dashboards can transform the way organizations monitor operations and make decisions.
By providing current information, dashboards can help businesses identify problems earlier, monitor KPIs, reduce manual reporting, improve team coordination, and respond more quickly to changing conditions.
However, the goal should not simply be to make data update faster. The real objective is to provide relevant, reliable information at the moment it can influence a useful decision.
For growing businesses, a well-designed real-time dashboard can become an important management tool, connecting data, people, and workflows in one place and helping organizations move from reactive decision-making toward more proactive business management.