Table of Contents
- How Real-Time Business Dashboards Help Companies Make Faster Decisions
- What Is a Real-Time Business Dashboard?
- Why Real-Time Information Matters
- 1. Faster Decision-Making
- 2. One Centralized View of Business Performance
- 3. Easier KPI Monitoring
- 4. Problems Can Be Identified Earlier
- 5. Less Dependence on Manual Reports
- 6. Better Coordination Between Departments
- 7. Improved Customer Response
- 8. Better Sales and Marketing Decisions
- 9. Real-Time Inventory Visibility
- 10. Better Financial Visibility
- 11. Alerts Can Help Teams Act Quickly
- 12. Data Becomes Easier to Understand
- What Should a Business Dashboard Include?
- KPI Cards
- Interactive Charts
- Filters
- Drill-Down Information
- Alerts
- Role-Based Access
- Real-Time Dashboard vs Traditional Reporting
- How Businesses Can Implement a Dashboard Successfully
- The Future of Business Dashboards
- Conclusion
How Real-Time Business Dashboards Help Companies Make Faster Decisions
Businesses generate data every day through sales, customer interactions, expenses, marketing campaigns, inventory, employees, projects, and other operations. The challenge is not simply collecting this information. The real challenge is understanding it quickly enough to make the right decision.
Traditional reports often require employees to collect information, update spreadsheets, prepare summaries, and share them with management. By the time the report is ready, the situation may have already changed.
A real-time business dashboard provides a centralized view of important business information and can continuously update as new data becomes available. This allows decision-makers to monitor performance, identify changes, and respond more quickly.
What Is a Real-Time Business Dashboard?
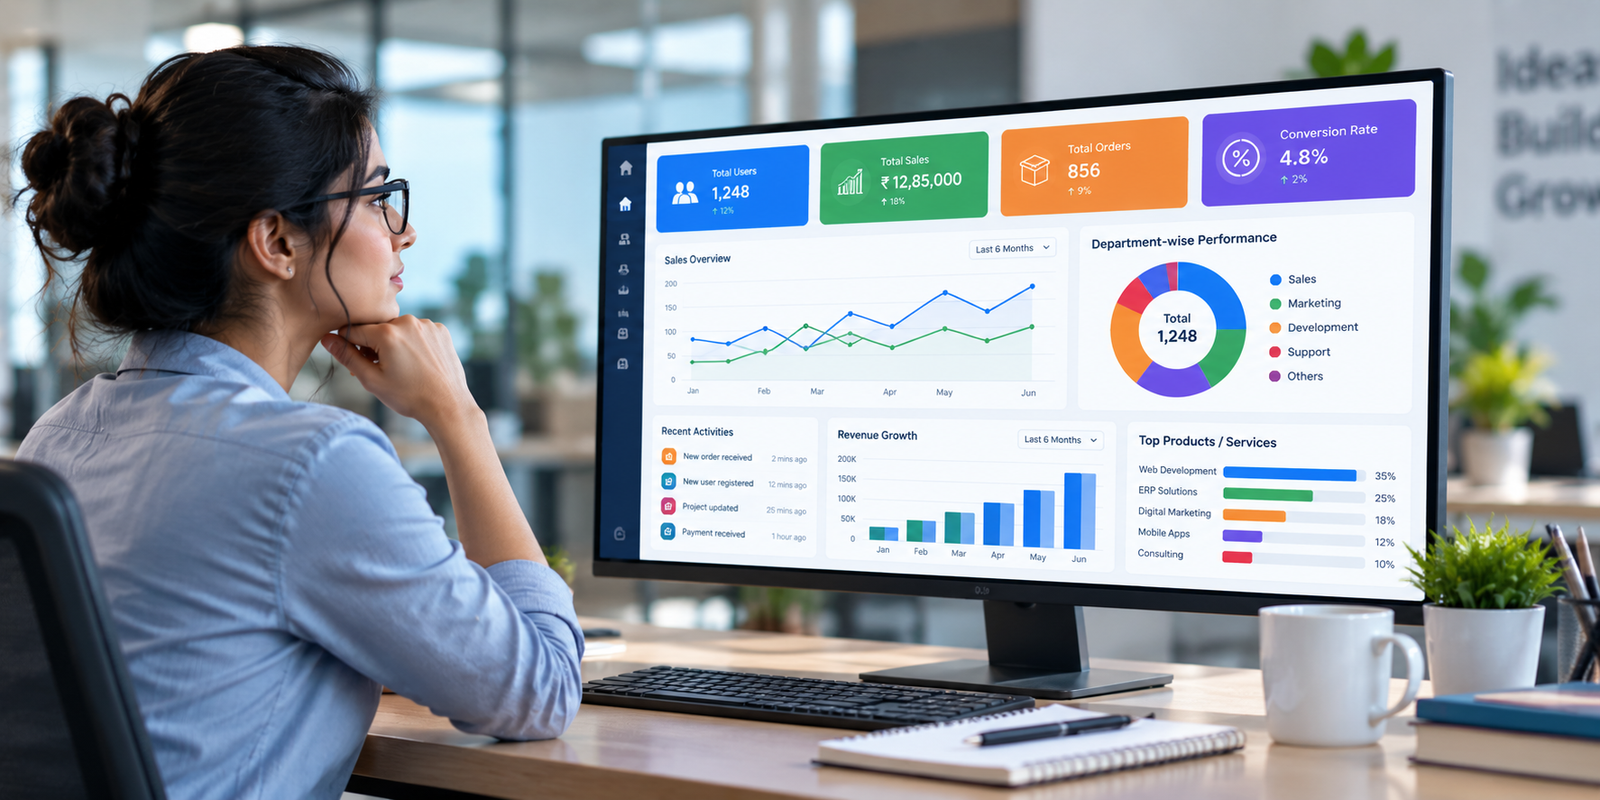
A real-time business dashboard is a digital interface that displays important business metrics, KPIs, charts, reports, and operational information in one place.
Instead of searching through multiple spreadsheets or applications, managers can view relevant information through a centralized dashboard.
Depending on the business, a dashboard may display:
-
Sales and revenue
-
Expenses and cash flow
-
Customer information
-
Leads and conversions
-
Inventory levels
-
Employee performance
-
Project progress
-
Website traffic
-
Marketing performance
-
Pending tasks
-
Business targets
The exact information should depend on what the organization needs to monitor and what decisions it needs to make.
Why Real-Time Information Matters
Business conditions can change quickly. A sudden increase in orders, a drop in sales, low inventory, an increase in customer complaints, or a delayed project may require immediate attention.
When information is available only through weekly or monthly reports, management may discover the issue later.
Real-time dashboards reduce the delay between an event occurring and decision-makers becoming aware of it. Modern dashboard systems can also provide alerts when selected metrics reach predefined thresholds.
1. Faster Decision-Making
One of the biggest advantages of a real-time dashboard is faster access to relevant information.
For example, imagine a sales manager wants to know how the team is performing today. Instead of asking employees for separate updates, opening multiple spreadsheets, and manually calculating totals, the manager can view the relevant KPIs on the dashboard.
This makes it easier to move from:
Data → Information → Insight → Action
The dashboard does not make the decision automatically. Instead, it gives decision-makers the information they need at the right time.
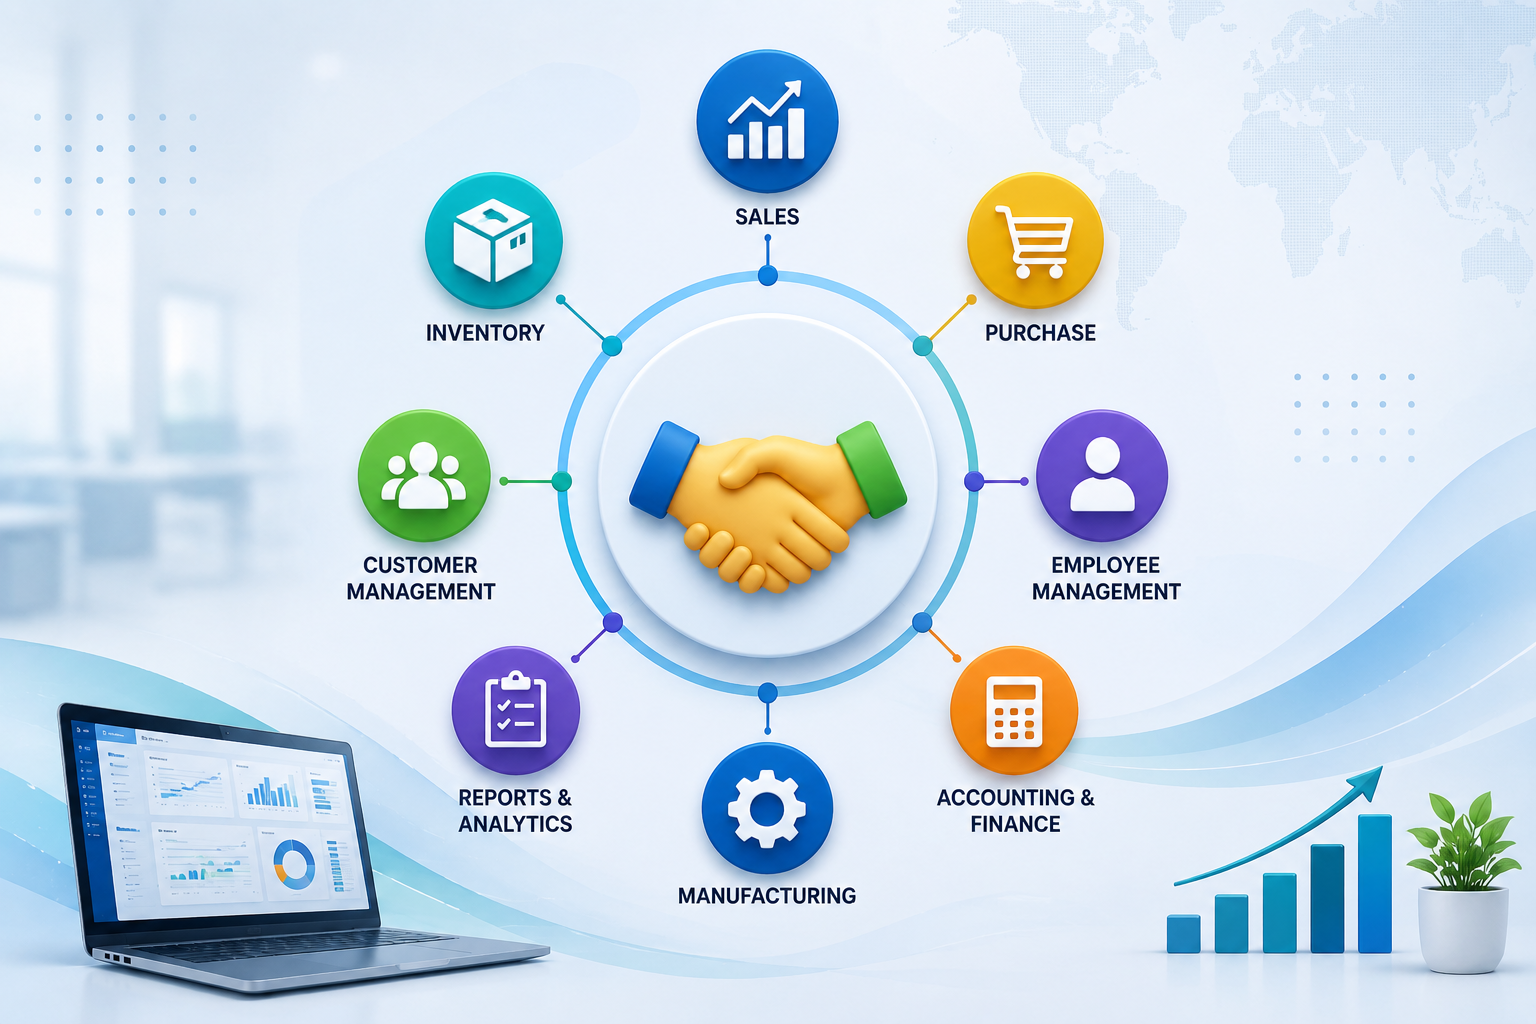
2. One Centralized View of Business Performance
Many businesses use different systems for different activities.
Sales information may exist in a CRM, financial data in accounting software, employee information in an HR system, and operational data in an ERP.
A dashboard can bring relevant information from multiple sources into a common view. BI dashboards are commonly designed to consolidate metrics from different systems so users can monitor performance without repeatedly examining raw data.
This creates a clearer picture of what is happening across the organization.
3. Easier KPI Monitoring
Key Performance Indicators, or KPIs, help businesses measure progress toward specific goals.
Depending on the organization, important KPIs may include:
-
Monthly sales
-
Revenue growth
-
Profit margin
-
Number of new leads
-
Conversion rate
-
Customer retention
-
Inventory turnover
-
Project completion
-
Employee productivity
A dashboard can place these KPIs in visible locations so managers can quickly compare current performance with targets.
It is also useful to distinguish between KPIs that show past performance and indicators that provide signals about future performance.
4. Problems Can Be Identified Earlier
A major benefit of real-time visibility is the ability to identify unusual changes before they become larger problems.
For example:
Inventory falls below the required level → Manager receives an alert → Purchase process begins
Or:
Sales conversion drops → Manager notices the change → Sales strategy is reviewed
Or:
Customer complaints increase → Support team investigates → Service issue is addressed
This approach allows companies to respond proactively instead of waiting for a problem to appear in a later report.
5. Less Dependence on Manual Reports
Preparing business reports manually can consume significant employee time.
Employees may need to:
-
Collect data from different sources
-
Export spreadsheets
-
Clean the information
-
Calculate totals
-
Create charts
-
Format the report
-
Send it to management
An automated dashboard can reduce much of this repetitive reporting work.
Business intelligence platforms commonly automate data collection, analysis, and visualization processes, reducing the effort required to turn raw information into usable insights.
6. Better Coordination Between Departments
A shared dashboard can help different teams work with the same business information.
For example, the sales team can see sales targets, while management can monitor overall revenue. The operations team can monitor pending work, while finance can track relevant financial metrics.
When teams work from consistent information, discussions can become more focused.
Instead of asking, "What is happening?", teams can spend more time discussing:
"Why is it happening, and what should we do next?"
7. Improved Customer Response
Real-time information can also improve customer service.
For example, a company can monitor:
-
New enquiries
-
Pending support requests
-
Customer complaints
-
Order status
-
Service requests
-
Response times
-
Customer activity
If an important customer enquiry remains unanswered, the responsible team can identify it quickly.
Faster access to current information can help businesses respond to customer needs more effectively.
8. Better Sales and Marketing Decisions
Sales and marketing teams generate large amounts of data.
A dashboard can bring together information such as:
-
Leads received
-
Leads contacted
-
Qualified leads
-
Conversions
-
Revenue generated
-
Campaign performance
-
Cost per lead
-
Website traffic
-
Customer acquisition
Instead of waiting until the end of a campaign to evaluate performance, teams can monitor important metrics while the campaign is running.
This makes it easier to identify which activities are performing well and where adjustments may be required.
9. Real-Time Inventory Visibility
For businesses that sell physical products, inventory information is particularly important.
A dashboard can help monitor:
-
Current stock
-
Low-stock products
-
Fast-moving products
-
Slow-moving products
-
Pending purchases
-
Sales by product
-
Stock movement
For example, if a popular product is approaching its minimum stock level, the business can take action before it becomes unavailable.
10. Better Financial Visibility
Financial decisions require accurate and timely information.
A business dashboard can provide management with a high-level view of:
-
Revenue
-
Expenses
-
Outstanding payments
-
Receivables
-
Payables
-
Profitability
-
Monthly performance
-
Department-wise expenses
Rather than relying exclusively on periodic reports, management can monitor selected financial indicators throughout the month.
However, dashboards should always use reliable source data and clearly defined metrics. A visually attractive dashboard cannot compensate for inaccurate or poorly governed data.
11. Alerts Can Help Teams Act Quickly
A dashboard becomes even more useful when it can alert users about important changes.
For example:
-
Inventory below minimum level
-
Sales below target
-
Unusually high expenses
-
Pending customer enquiries
-
Overdue payments
-
Project delays
-
Unusual website activity
Threshold-based alerts can help shift dashboards from passive reporting toward proactive monitoring.
12. Data Becomes Easier to Understand
Large spreadsheets can be difficult to interpret.
Dashboards use visual elements such as:
-
Charts
-
Graphs
-
KPI cards
-
Tables
-
Progress indicators
-
Filters
-
Trend lines
These visualizations can make patterns easier to recognize.
For example, a line chart showing six months of sales may immediately reveal whether sales are increasing, decreasing, or remaining stable.
What Should a Business Dashboard Include?
A useful dashboard should focus on information that supports actual business decisions.
Important elements may include:
KPI Cards
Display important numbers such as revenue, sales, customers, expenses, or pending tasks.
Interactive Charts
Allow users to understand trends and compare performance.
Filters
Allow managers to view information by month, department, product, employee, region, or other relevant categories.
Drill-Down Information
Users should be able to move from a summary figure to the underlying details when necessary.
Alerts
Important changes should be highlighted so that users know where attention is required.
Role-Based Access
Different employees may need access to different information. Proper permissions help protect sensitive business data.
Real-Time Dashboard vs Traditional Reporting
| Traditional Reporting | Real-Time Dashboard |
|---|---|
| Often periodic | Frequently updated |
| Can require manual preparation | Can automate reporting |
| Information may become outdated | Provides more current visibility |
| Usually static | Often interactive |
| Limited immediate monitoring | Supports continuous monitoring |
| Problems may be discovered later | Issues can be identified earlier |
The right approach depends on the business. Not every metric needs second-by-second updates. Some information may only need daily, weekly, or monthly updates.
The important point is to match the data-refresh frequency with the decision that the information supports.
How Businesses Can Implement a Dashboard Successfully
Building a dashboard is not only about adding attractive charts.
Businesses should first identify:
-
What decisions need to be made?
-
Which metrics support those decisions?
-
Where does the required data come from?
-
How frequently should the data be updated?
-
Who should have access?
-
What alerts are actually useful?
The dashboard should then be designed around these requirements.
A simple dashboard containing the right KPIs is generally more useful than a complicated dashboard filled with information that nobody uses.
The Future of Business Dashboards
Business dashboards are becoming increasingly connected with automation, cloud systems, analytics, and artificial intelligence.
Modern platforms can combine live data monitoring with interactive analysis, anomaly detection, alerts, and automated workflows.
This means future dashboards may increasingly move beyond simply answering:
"What happened?"
and help teams explore:
"What is happening?"
"Why is it happening?"
"What could happen next?"
"What action should we consider?"
Conclusion
Real-time business dashboards can help organizations reduce reporting delays, monitor important KPIs, identify problems earlier, and make decisions using current business information.
From sales and finance to inventory, marketing, customer service, and project management, a well-designed dashboard can provide a centralized view of business performance.
However, the value of a dashboard depends on the quality of the underlying data, the relevance of the KPIs, and how effectively teams use the information.
For growing businesses, moving from scattered spreadsheets and delayed reports toward centralized, data-driven dashboards can be an important step toward faster and more informed decision-making.