Table of Contents
- How Data Analytics Helps Businesses Understand Their Performance
- What Is Data Analytics?
- Why Businesses Need Data Analytics
- 1. Understand Sales Performance
- 2. Understand Customer Behaviour
- 3. Monitor Business Trends
- 4. Improve Inventory Management
- 5. Measure Marketing Performance
- 6. Track Financial Performance
- 7. Compare Different Branches or Locations
- 8. Identify Problems Earlier
- 9. Create Business Dashboards
- 10. Support Better Decision-Making
- Common Challenges With Business Data
- Poor Data Quality
- Data Stored in Different Systems
- Lack of Consistent Reporting
- Too Much Data
- Lack of Regular Analysis
- How Businesses Can Start Using Data Analytics
- Data Analytics and Business Software
- Final Thoughts
How Data Analytics Helps Businesses Understand Their Performance
Businesses generate data every day. Sales transactions, customer enquiries, website visits, inventory movements, employee activities, marketing campaigns, and financial records all create valuable information.
However, simply collecting data does not help a business grow. Businesses need to understand what that data means and use it to make informed decisions. This is where data analytics becomes important.
Data analytics helps businesses turn raw information into meaningful insights. It can show what is working, where problems are occurring, how customers are behaving, and where opportunities may exist.
What Is Data Analytics?
Data analytics is the process of collecting, organizing, examining, and interpreting data to identify useful patterns and trends.
For a business, this could mean analyzing:
-
Monthly sales
-
Product performance
-
Customer purchases
-
Website traffic
-
Marketing campaigns
-
Inventory levels
-
Employee performance
-
Expenses and revenue
-
Customer enquiries
-
Regional or branch performance
Instead of looking at individual records separately, analytics allows businesses to see the bigger picture.
Why Businesses Need Data Analytics
Many business decisions are traditionally based on experience or assumptions. Experience is valuable, but accurate data can provide additional evidence to support those decisions.
For example, a business may believe that one product is its best seller. Sales data might show that another product actually generates more revenue because it has a higher average order value.
Similarly, a business may assume that a particular marketing campaign is successful because it generates many enquiries. Analytics can reveal whether those enquiries are actually turning into customers.
Data helps businesses move from assumptions toward measurable information.
1. Understand Sales Performance
Sales data is one of the most useful sources of business information.
Analytics can help businesses identify:
-
Total sales
-
Sales by product
-
Sales by category
-
Sales by employee
-
Sales by location
-
Monthly and yearly trends
-
Average order value
-
Repeat purchases
-
Best-performing products
This information can help management understand where revenue is coming from and identify areas that require attention.
For example, if sales for a particular product category have declined for several months, management can investigate pricing, demand, competition, stock availability, or marketing activity.
2. Understand Customer Behaviour
Customers leave valuable signals through their interactions with a business.
Businesses can analyze customer data to understand:
-
What products customers purchase
-
How frequently they purchase
-
Which products are commonly purchased together
-
Which channels generate enquiries
-
How customers interact with a website
-
How many customers return
-
Which customer segments generate the most revenue
These insights can help businesses create more relevant products, services, offers, and customer experiences.
3. Monitor Business Trends
Looking at a single day's or month's data may not reveal much.
Data analytics becomes more useful when businesses compare information over time.
For example, a business can compare:
January → February → March → April → May
This can reveal whether revenue is increasing, decreasing, or remaining stable.
Businesses can also identify seasonal patterns. A retailer may discover that certain products consistently perform better during specific months, allowing management to plan inventory and marketing activities accordingly.
4. Improve Inventory Management
Inventory directly affects both customer satisfaction and business costs.
Too much inventory can tie up working capital, while insufficient inventory can lead to missed sales.
Analytics can help businesses monitor:
-
Fast-moving products
-
Slow-moving products
-
Stock turnover
-
Reorder patterns
-
Stock shortages
-
Excess inventory
-
Product demand
With better visibility, businesses can make more informed purchasing and stocking decisions.
5. Measure Marketing Performance
Businesses often invest money in Google Ads, social media, SEO, email marketing, and other promotional activities.
Analytics can help determine whether those investments are producing meaningful results.
Important metrics can include:
-
Website visitors
-
Leads
-
Conversion rate
-
Cost per lead
-
Customer acquisition cost
-
Revenue generated
-
Return on advertising spend
-
Campaign performance
For example, two campaigns may generate a similar number of leads, but one may produce significantly more paying customers. Analytics helps identify this difference.
6. Track Financial Performance
Financial analytics provides businesses with a clearer view of their financial position.
Businesses can monitor:
-
Revenue
-
Expenses
-
Profit
-
Outstanding payments
-
Cash flow
-
Cost categories
-
Monthly financial trends
A simple revenue figure does not always tell the full story. A company may have increasing sales but declining profits because expenses are growing faster.
Analyzing multiple financial indicators gives management a more complete understanding of business performance.
7. Compare Different Branches or Locations
Businesses operating across multiple branches can use analytics to compare performance.
For example:
| Branch | Sales | Orders | Customers |
|---|---|---|---|
| Branch A | ₹12 lakh | 1,850 | 1,420 |
| Branch B | ₹9 lakh | 1,430 | 1,120 |
| Branch C | ₹15 lakh | 2,100 | 1,680 |
This type of comparison can help management identify differences between locations.
However, the numbers should always be interpreted in context. A branch with higher sales may also have higher operating costs or a larger customer base.
8. Identify Problems Earlier
One major benefit of analytics is the ability to identify unusual changes.
Suppose monthly sales normally remain between ₹8 lakh and ₹10 lakh, but suddenly fall to ₹6 lakh.
Instead of discovering the problem at the end of the financial year, management can investigate the change much earlier.
Possible causes might include:
-
Reduced customer demand
-
Stock shortages
-
Pricing changes
-
Employee turnover
-
Website problems
-
Marketing changes
-
Increased competition
Early visibility gives businesses more time to investigate and respond.
9. Create Business Dashboards
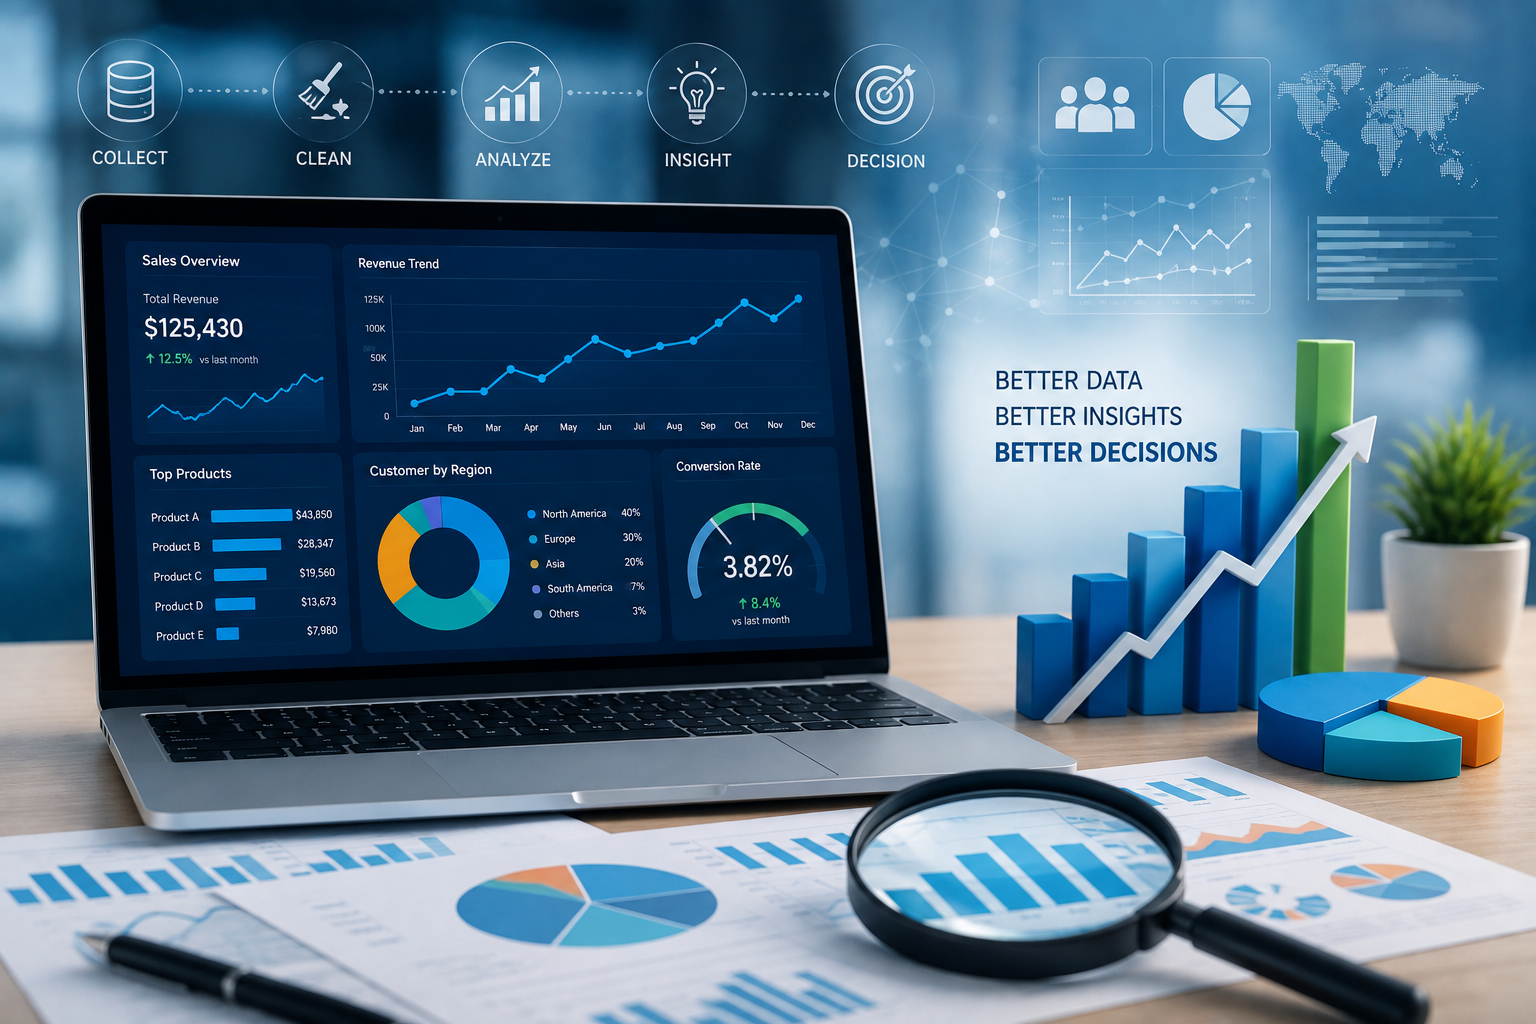
A business dashboard can bring important metrics together in one place.
Instead of opening multiple spreadsheets and systems, management can view key information through charts, graphs, tables, and summary indicators.
A useful dashboard might display:
Sales | Orders | Customers | Revenue | Expenses | Inventory | Leads | Conversions
Dashboards are particularly useful for managers who need a quick overview of business performance without reviewing large amounts of raw data.
10. Support Better Decision-Making
The purpose of analytics is not simply to create charts.
The real value comes from using information to make better-informed business decisions.
For example:
Data: Product A sales increased by 25%.
Insight: Demand for Product A is growing.
Business action: Consider increasing inventory and evaluating whether additional marketing could support further demand.
This demonstrates the difference between data and insight.
Data tells you what happened. Analytics helps you understand why it happened and what may require attention.
Common Challenges With Business Data
Although analytics can provide significant value, businesses can face several challenges.
Poor Data Quality
Incorrect, incomplete, or duplicate records can produce misleading results.
Data Stored in Different Systems
Sales, inventory, customer, and financial information may exist in separate systems, making analysis more difficult.
Lack of Consistent Reporting
If different departments use different definitions or reporting methods, comparing their results can become difficult.
Too Much Data
More data does not automatically mean better decisions. Businesses need to focus on the metrics that actually relate to their objectives.
Lack of Regular Analysis
A dashboard is useful only when businesses regularly review the information and take appropriate action.
How Businesses Can Start Using Data Analytics
Businesses do not necessarily need a complex analytics system from the beginning.
A practical approach is to start with a few important questions:
-
What are our main business goals?
-
Which metrics indicate whether we are achieving them?
-
Where is the required data stored?
-
Is the data accurate and consistent?
-
How frequently should the information be reviewed?
-
Who will use the reports?
-
What actions should be taken based on the results?
Once these questions are answered, businesses can gradually build reporting and analytics capabilities.
Data Analytics and Business Software
Modern business software can make analytics easier by bringing operational data into a centralized system.
For example, an integrated business platform can connect information from:
-
Sales
-
Inventory
-
Customers
-
Employees
-
Finance
-
Orders
-
Marketing
-
Reports
When these records are connected, businesses can create more useful reports and dashboards.
Instead of manually combining information from multiple spreadsheets, management can access updated information from a centralized platform.
Final Thoughts
Data analytics gives businesses a clearer understanding of what is happening across their operations.
It can help management monitor sales, understand customers, identify trends, improve inventory planning, evaluate marketing, track financial performance, and identify potential problems earlier.
The most valuable analytics is not necessarily the most complicated. Even simple, accurate reports can provide meaningful insights when they are connected to real business questions.
For growing businesses, developing a reliable approach to collecting, analyzing, and using data can create a stronger foundation for informed decision-making and long-term growth.