Table of Contents
- How Data Analytics Helps Small Businesses Make Smarter Decisions
- What Is Data Analytics?
- Why Data Analytics Matters for Small Businesses
- 1. Make Better Business Decisions
- 2. Understand Customer Behavior
- 3. Improve Marketing Performance
- 4. Identify Sales Trends
- 5. Manage Inventory More Effectively
- 6. Monitor Financial Performance
- 7. Improve Operational Efficiency
- 8. Track Key Performance Indicators
- 9. Create Easy-to-Understand Dashboards
- 10. Find New Business Opportunities
- Data Analytics Tools for Small Businesses
- How to Start Using Data Analytics
- Step 1: Define Your Business Questions
- Step 2: Identify Your Data Sources
- Step 3: Clean the Data
- Step 4: Build Useful Reports
- Step 5: Identify Patterns
- Step 6: Take Action
- Common Mistakes Small Businesses Should Avoid
- Collecting Too Much Data
- Ignoring Data Quality
- Tracking Vanity Metrics
- Creating Complicated Dashboards
- Failing to Act on Insights
- Data Analytics and Business Growth
- Protecting Business Data
- Conclusion
How Data Analytics Helps Small Businesses Make Smarter Decisions
In today's competitive business environment, making decisions based on assumptions alone can be risky. Small businesses generate valuable information every day through sales, customer interactions, website visits, marketing campaigns, inventory records, and financial transactions. The challenge is turning that information into useful insights.
Data analytics helps businesses examine their data, identify patterns, measure performance, and make more informed decisions.
For small businesses, analytics does not necessarily require a complicated or expensive system. Even simple dashboards and well-organized reports can help business owners understand what is working, where problems exist, and where new opportunities may be available.
Logic Waves Tech includes data analytics among its services, with a focus on dashboards, reports, and business insights.
What Is Data Analytics?
Data analytics is the process of collecting, organizing, examining, and interpreting data to discover useful information.
For a small business, data might come from:
- Sales transactions
- Website traffic
- Customer inquiries
- Social media
- Advertising campaigns
- Inventory systems
- Accounting software
- Customer relationship management systems
- Online stores
- Employee performance records
Analytics transforms this raw information into reports, charts, dashboards, and insights that can support business decisions.
Why Data Analytics Matters for Small Businesses
Large companies often have dedicated teams analyzing business performance. Small businesses may have fewer resources, but they still generate large amounts of useful data.
The right analytics approach can help business owners answer questions such as:
- Which products sell the most?
- Which marketing channel generates the best leads?
- Which customers return most frequently?
- Which months generate the highest revenue?
- Where are expenses increasing?
- Which services are most profitable?
- Which areas of the business need improvement?
Instead of relying entirely on intuition, business owners can use actual performance data to guide their decisions.
1. Make Better Business Decisions
One of the biggest advantages of analytics is improved decision-making.
For example, a business owner may believe that one product is the company's best seller. After analyzing sales data, they may discover that another product generates more revenue or profit.
This information can influence:
- Inventory planning
- Marketing budgets
- Pricing strategies
- Product promotions
- Sales targets
- Business expansion
Data does not eliminate the need for human judgment. Instead, it gives decision-makers better information to work with.
2. Understand Customer Behavior
Customer data can reveal important patterns.
Businesses can analyze information such as:
- Purchase frequency
- Average order value
- Product preferences
- Repeat purchases
- Customer locations
- Website behavior
- Inquiry patterns
Understanding these patterns can help businesses create better customer experiences.
For example, if analytics shows that customers frequently purchase two products together, the business could create a bundle or recommendation around those products.
3. Improve Marketing Performance
Marketing without measurement can result in wasted resources.
Analytics allows businesses to compare marketing channels and determine which activities generate meaningful results.
A company might compare:
- Google Ads
- Organic search
- Social media
- Email campaigns
- Referral traffic
- Direct website traffic
Instead of simply asking how many people saw an advertisement, businesses can examine deeper metrics such as leads, conversions, customer acquisition cost, and revenue generated.
This can help businesses allocate marketing budgets more effectively.
4. Identify Sales Trends
Sales rarely remain constant throughout the year.
Analytics can help identify:
- Seasonal demand
- Monthly sales patterns
- Product trends
- Customer purchasing behavior
- High-performing sales periods
- Declining product categories
For example, a retailer might discover that demand increases significantly during specific months.
The business can then prepare inventory and marketing campaigns in advance rather than reacting after demand has already increased.
5. Manage Inventory More Effectively
For businesses that sell physical products, inventory management is critical.
Too much inventory can tie up money, while too little inventory can result in missed sales.
Analytics can help businesses identify:
- Fast-moving products
- Slow-moving products
- Frequently out-of-stock items
- Seasonal demand
- Inventory turnover
- Purchasing patterns
These insights can support better inventory planning.
6. Monitor Financial Performance
Data analytics can also help businesses understand financial performance.
Business owners can monitor:
- Revenue
- Expenses
- Profit margins
- Operating costs
- Customer acquisition costs
- Product profitability
- Monthly financial trends
A revenue increase does not necessarily mean a business is becoming more profitable. Expenses may also be increasing.
By analyzing revenue and costs together, business owners can develop a clearer picture of financial health.
7. Improve Operational Efficiency
Analytics is not only useful for sales and marketing.
It can also help businesses identify operational inefficiencies.
For example, a company may analyze:
- Order processing times
- Customer response times
- Delivery performance
- Employee productivity
- Support requests
- Production output
If a particular process consistently takes longer than expected, management can investigate the cause and look for ways to improve it.
8. Track Key Performance Indicators
Businesses need measurable goals to understand whether they are progressing.
Key Performance Indicators (KPIs) are measurable values used to evaluate business performance.
Depending on the organization, useful KPIs may include:
- Monthly revenue
- Conversion rate
- Customer retention rate
- Average order value
- Website conversion rate
- Cost per lead
- Customer acquisition cost
- Profit margin
- Number of qualified leads
A dashboard can bring these indicators together so business owners can monitor performance more efficiently.
9. Create Easy-to-Understand Dashboards
Raw spreadsheets can contain useful information but may be difficult to interpret quickly.
A dashboard can present important information using:
- Charts
- Graphs
- Tables
- KPI cards
- Filters
- Trend lines
- Comparisons
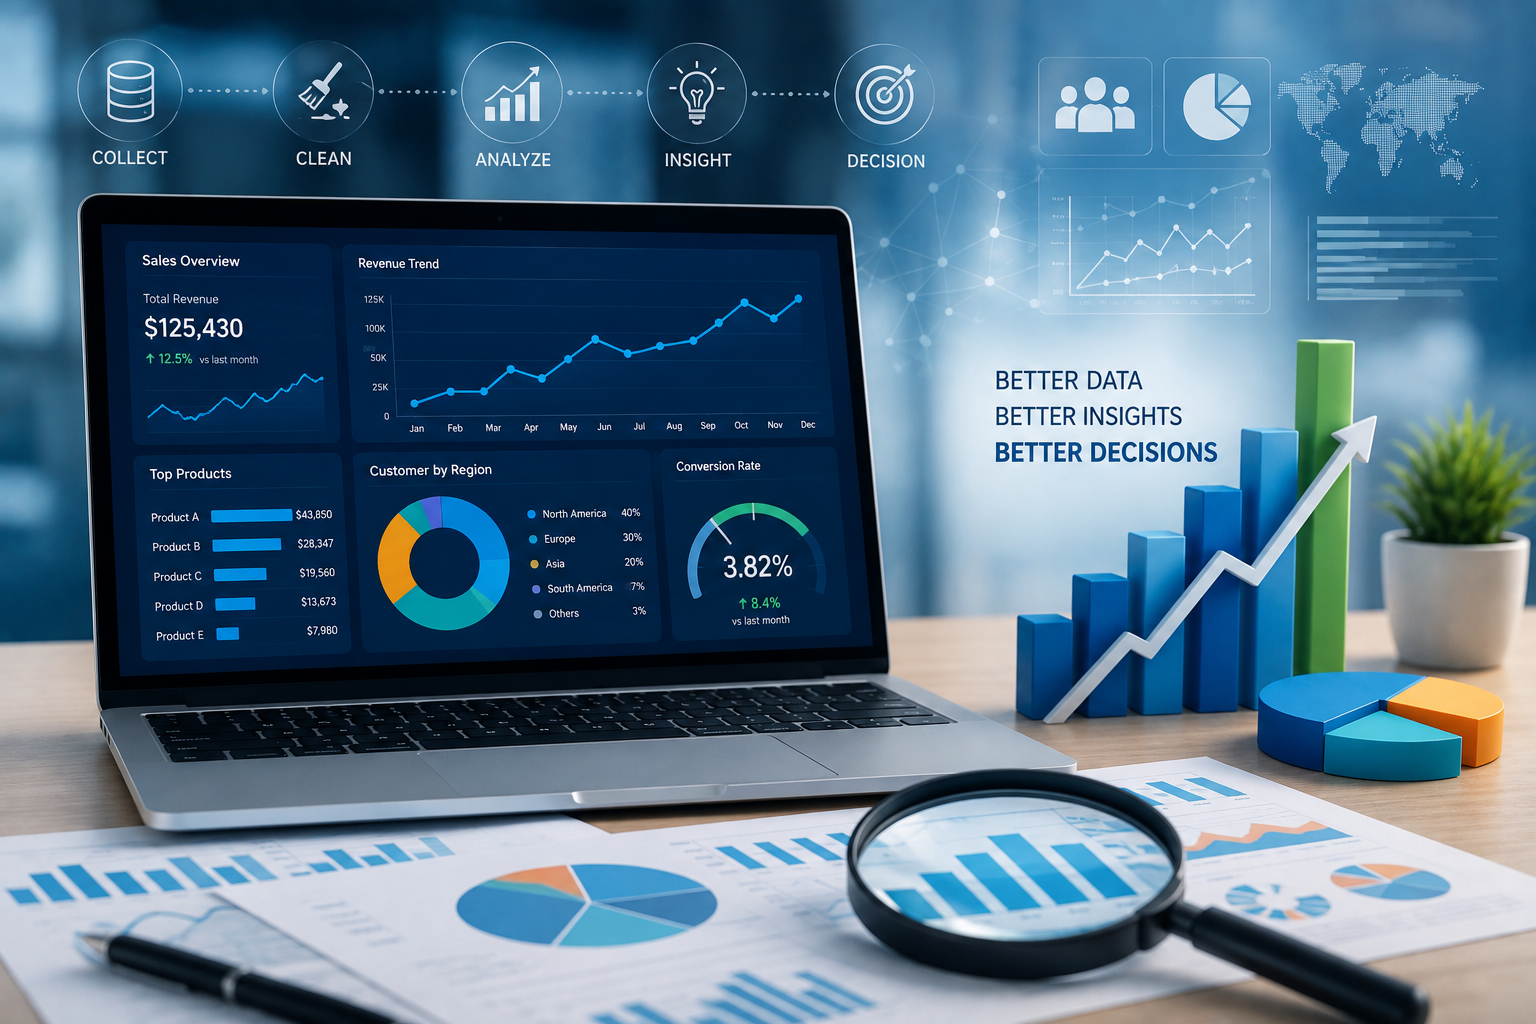
For example, a sales dashboard could show monthly revenue, best-selling products, regional sales, and conversion rates in one place.
This makes it easier for decision-makers to identify important trends without manually reviewing large amounts of data.
10. Find New Business Opportunities
Analytics can reveal opportunities that might otherwise remain hidden.
For example, a company may discover that:
- Customers from a particular region purchase more frequently.
- A specific service has increasing demand.
- A particular customer segment generates higher revenue.
- A product category is growing faster than others.
- A marketing campaign performs especially well with a certain audience.
These findings can support decisions about new products, services, markets, and promotional strategies.
Data Analytics Tools for Small Businesses
Small businesses do not always need complex enterprise systems.
Depending on their requirements, they may use tools such as:
- Microsoft Excel
- SQL databases
- Power BI
- Google Analytics
- Google Search Console
- Looker Studio
- Shopify analytics
- CRM reporting systems
The best tool depends on the business's data sources, technical requirements, budget, and reporting needs.
Logic Waves Tech specifically highlights tools and technologies such as Excel, SQL, Power BI, GA4, Google Search Console, and Looker Studio within its data and analytics ecosystem.
How to Start Using Data Analytics
Small businesses can begin with a simple approach.
Step 1: Define Your Business Questions
Start by identifying what you want to understand.
For example:
"Which marketing channel generates the most qualified customers?"
This is more useful than collecting data without a specific purpose.
Step 2: Identify Your Data Sources
Determine where relevant information is stored.
This could include:
- Website analytics
- Sales software
- CRM
- Accounting systems
- Advertising platforms
- Spreadsheets
- eCommerce platforms
Step 3: Clean the Data
Incorrect, duplicate, or incomplete information can produce misleading results.
Before analyzing data, check for:
- Duplicate records
- Missing values
- Incorrect entries
- Inconsistent formats
- Outdated information
Step 4: Build Useful Reports
Create reports that focus on the metrics that actually matter to the business.
Avoid filling dashboards with dozens of unnecessary numbers.
Step 5: Identify Patterns
Look for changes and relationships in the data.
Ask:
- What increased?
- What decreased?
- What remained stable?
- What changed unexpectedly?
- Why might the change have occurred?
Step 6: Take Action
Analytics becomes valuable when insights lead to action.
If the data shows that a marketing campaign is underperforming, the business can test a different strategy.
If a product consistently performs well, the company may increase its inventory or promotional efforts.
Common Mistakes Small Businesses Should Avoid
Collecting Too Much Data
More data does not automatically mean better decisions.
Focus on information that supports meaningful business questions.
Ignoring Data Quality
Poor-quality data can lead to incorrect conclusions.
Data should be reviewed and maintained regularly.
Tracking Vanity Metrics
Some numbers may look impressive without contributing to business goals.
For example, website traffic alone does not necessarily indicate business success. Conversions, qualified leads, and revenue may provide more meaningful information.
Creating Complicated Dashboards
A dashboard should make information easier to understand, not more confusing.
Keep important metrics visible and organize information logically.
Failing to Act on Insights
Analytics has little value if businesses collect reports but never use them to improve operations.
The goal is not simply to create dashboards. The goal is to make better decisions.
Data Analytics and Business Growth
As a business grows, the amount of information it generates can increase significantly.
A structured analytics system can help management move from reactive decision-making toward more proactive planning.
Instead of asking:
"What happened?"
Businesses can gradually move toward questions such as:
"Why did it happen?"
and eventually:
"What should we do next?"
This progression can make analytics an important part of long-term business strategy.
Protecting Business Data
Data analytics should also be accompanied by responsible data management.
Businesses should consider:
- Access controls
- Secure passwords
- Regular backups
- Data encryption where appropriate
- Secure APIs
- Software updates
- Privacy requirements
- User permissions
Only authorized individuals should have access to sensitive business and customer information.
Conclusion
Data analytics can give small businesses a clearer understanding of their customers, sales, marketing, finances, and operations.
Businesses do not necessarily need massive datasets or complicated technology to benefit from analytics. Starting with a few important business questions and building simple, reliable dashboards can already provide valuable insights.
The key is to collect the right data, maintain its quality, understand what it means, and turn insights into action.
As businesses become increasingly digital, data analytics can help transform everyday information into smarter decisions, better customer experiences, improved efficiency, and sustainable growth.
This article is intended for general informational purposes and should not be considered a substitute for professional financial, legal, or business consulting advice.