Table of Contents
- The Role of Management Dashboards in Modern Business Operations
- What Is a Management Dashboard?
- Why Businesses Need Management Dashboards
- Turning Data into Actionable Information
- Supporting Faster Decision-Making
- Monitoring Key Performance Indicators
- Real-Time Business Visibility
- Improving Departmental Performance
- Reducing Manual Reporting
- Improving Data Accuracy
- Better Resource Management
- Improving Project Management
- Supporting Financial Monitoring
- Customer and Sales Insights
- Management Dashboards and Automation
- Custom Dashboards for Different Roles
- Security and Access Control
- Designing an Effective Management Dashboard
- Keep It Simple
- Use Clear Visuals
- Provide Filtering
- Highlight Important Changes
- Make It Responsive
- Connecting Multiple Business Systems
- Management Dashboards for Growing Businesses
- Common Mistakes to Avoid
- How to Start Building a Management Dashboard
- Conclusion
The Role of Management Dashboards in Modern Business Operations
Modern businesses generate large amounts of information every day. Sales transactions, customer interactions, project updates, employee activities, financial records, marketing results, and operational data all contribute to the overall picture of a business.
The challenge is not simply collecting this information. The real challenge is understanding it quickly and using it to make better decisions.
Management dashboards help solve this problem by bringing important business information into a structured and visual interface. Instead of reviewing multiple spreadsheets, reports, and applications, managers can use a dashboard to monitor key activities and performance from one place.
What Is a Management Dashboard?
A management dashboard is a digital interface that presents important business information through metrics, charts, tables, graphs, and status indicators.
It provides management with a summarized view of business performance and helps highlight areas that may require attention.
Depending on the organization's requirements, a management dashboard may display:
-
Sales performance
-
Revenue
-
Customer activity
-
Project progress
-
Employee performance
-
Financial information
-
Marketing results
-
Inventory levels
-
Pending tasks
-
Operational KPIs
The purpose is to present relevant information in a format that is easier to understand and act upon.
Why Businesses Need Management Dashboards
As businesses grow, the volume of information they generate also increases. Managers may receive reports from different departments and access data from multiple systems.
Without a structured way to view this information, it can become difficult to determine what is important.
A management dashboard can help by providing a centralized view of key business activities.
Instead of asking several departments for individual updates, managers can review available information through a single interface.
This can improve visibility and reduce the time spent collecting routine information.
Turning Data into Actionable Information
Raw business data does not always provide immediate insight.
For example, a database may contain thousands of customer records, but management may need to know how many new customers were acquired this month, which products are performing best, or where customer activity is declining.
A dashboard can summarize this information using visual indicators.
For example:
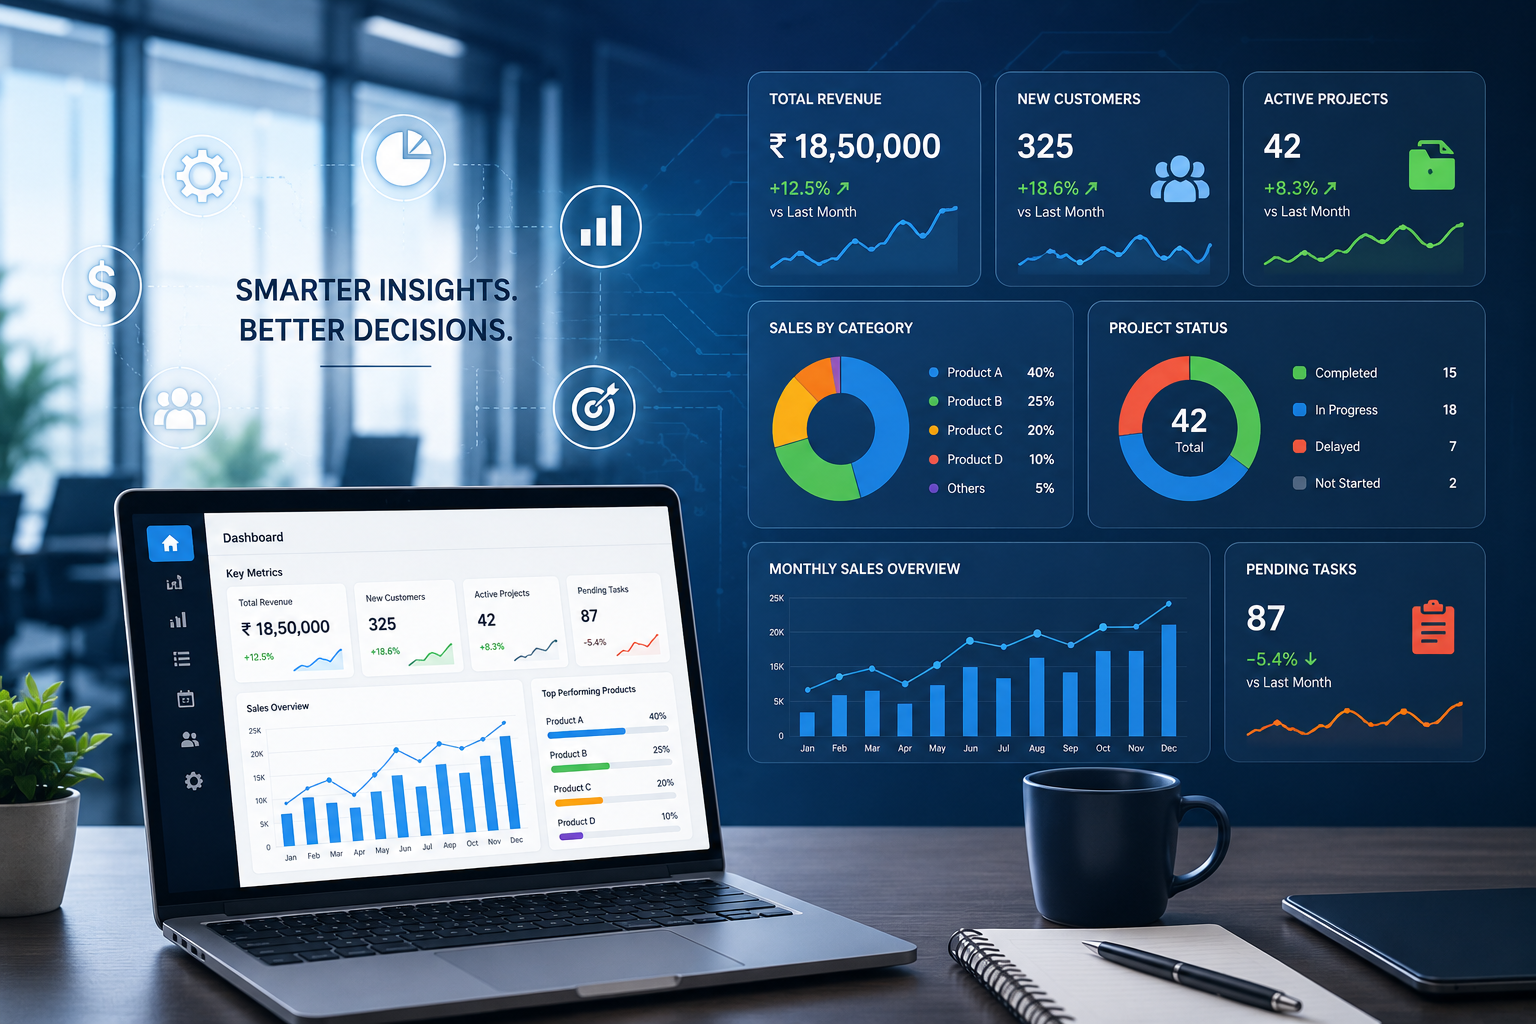
Monthly Revenue: ₹18,50,000
New Customers: 325
Active Projects: 42
Pending Tasks: 87
Completed Projects: 31
These summaries can help managers understand the current situation quickly.
Supporting Faster Decision-Making
Business decisions often need to be made quickly.
When information is scattered across different systems, managers may spend considerable time collecting and comparing data before taking action.
A dashboard can reduce this delay by presenting important information in one place.
For example, if sales performance has declined, a manager can review sales trends, customer acquisition, pending orders, product performance, and regional results to identify possible causes.
The dashboard does not make the decision automatically. It provides the information needed to make an informed decision.
Monitoring Key Performance Indicators
Key Performance Indicators, commonly known as KPIs, help organizations measure progress toward business objectives.
Different businesses require different KPIs.
A sales team may monitor:
-
Revenue
-
Leads
-
Conversion rate
-
Average order value
-
New customers
A project team may monitor:
-
Completed tasks
-
Pending tasks
-
Project deadlines
-
Resource utilization
-
Project completion percentage
A management dashboard can bring these KPIs together so that decision-makers can monitor them regularly.
Real-Time Business Visibility
Traditional reports are often prepared at specific intervals, such as weekly or monthly.
While scheduled reports are useful, managers may also need to understand what is happening currently.
When dashboards are connected to updated business data, they can provide a more current view of operations.
This can help management identify issues earlier rather than waiting for the next reporting cycle.
For example, a dashboard might immediately show that:
-
A project has passed its deadline
-
A sales target is falling behind
-
A large number of tasks are pending
-
Inventory has reached a predefined level
-
Customer requests are increasing
Early visibility allows teams to respond before small issues become larger problems.
Improving Departmental Performance
Management dashboards can help compare performance across departments, teams, locations, or business units.
For example, an organization with several branches may use a dashboard to compare:
-
Monthly sales
-
Customer growth
-
Expenses
-
Project completion
-
Employee activity
-
Service performance
This can help management identify areas performing well and areas that may need additional support.
The purpose of comparison should be to understand performance and identify improvement opportunities rather than simply rank employees or departments.
Reducing Manual Reporting
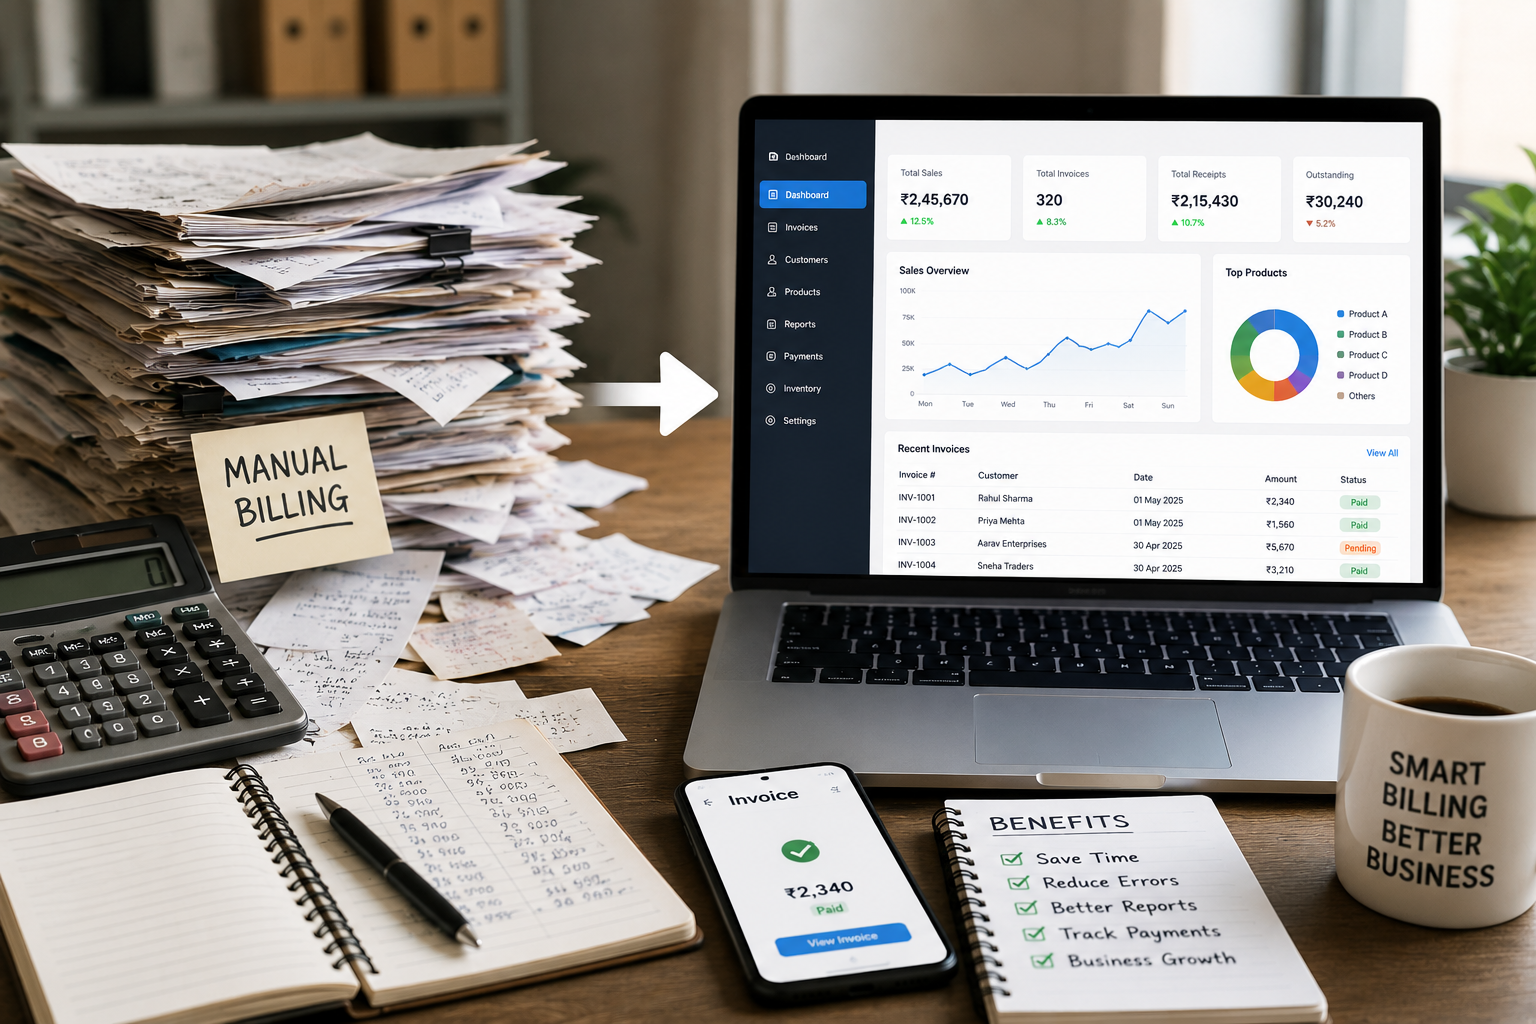
Preparing management reports manually can consume considerable administrative time.
Employees may need to collect information from spreadsheets, databases, emails, and other systems before creating a final report.
A well-designed dashboard can automate much of this process.
Once the relevant data sources are connected, the dashboard can calculate metrics and display them automatically.
This allows employees to spend less time preparing routine reports and more time analyzing results.
Improving Data Accuracy
Manual reporting can introduce errors.
Information may be copied incorrectly, calculations may be inconsistent, or an older version of a spreadsheet may be used.
Dashboards can reduce some of these problems by retrieving information directly from connected databases and systems.
Automated calculations and standardized data sources can also improve consistency.
However, dashboard accuracy still depends on the quality of the underlying data. A dashboard cannot provide reliable insights if the source information is incomplete or incorrect.
Better Resource Management
Businesses need to manage resources such as employees, budgets, equipment, inventory, and time.
A management dashboard can help visualize how these resources are being used.
For example, project managers can monitor employee workloads and identify situations where one team is overloaded while another has available capacity.
Similarly, finance teams can monitor budgets and expenses, while operations teams can monitor inventory and resource availability.
Better visibility can support more effective resource allocation.
Improving Project Management
Projects often involve multiple employees, deadlines, tasks, documents, and milestones.
A management dashboard can provide a project overview showing:
-
Total projects
-
Projects in progress
-
Completed projects
-
Delayed projects
-
Pending tasks
-
Upcoming deadlines
-
Team assignments
This makes it easier for managers to identify projects that require immediate attention.
Instead of reviewing individual project documents, management can start with a high-level overview and then investigate specific areas when necessary.
Supporting Financial Monitoring
Financial information is another important area where dashboards can provide value.
Depending on the system, management dashboards can display:
-
Revenue
-
Expenses
-
Profit
-
Outstanding payments
-
Budget utilization
-
Monthly financial trends
-
Department-wise expenses
Financial dashboards can help management understand the organization's financial position without manually compiling every figure.
For sensitive financial information, access should be restricted to authorized users.
Customer and Sales Insights
Customers are central to most businesses, making customer-related metrics important for management.
A dashboard can provide information such as:
-
New customers
-
Returning customers
-
Leads
-
Conversion rates
-
Customer complaints
-
Orders
-
Sales by product
-
Sales by location
These insights can help businesses understand customer behavior and identify opportunities for improving sales and service.
Management Dashboards and Automation
Dashboards become even more useful when combined with workflow automation.
For example, a dashboard can identify that a task is overdue and trigger a notification to the responsible employee.
Similarly, when a sales target is reached, the system could update performance metrics automatically.
Other examples include:
-
Automatic reminders
-
Approval notifications
-
Report generation
-
Status updates
-
Task assignments
-
Email notifications
-
Data synchronization
This creates a connection between monitoring and action.
Custom Dashboards for Different Roles
Different users need different information.
A CEO may want a high-level overview of revenue, growth, expenses, and major projects.
A sales manager may need detailed sales and lead information.
A project manager may focus on deadlines, tasks, and employee workloads.
An HR manager may need employee-related information.
A well-designed dashboard can provide role-specific views so that each user sees the information relevant to their responsibilities.
Security and Access Control
Management dashboards often contain sensitive business information, so security is an important part of their design.
Organizations should consider:
-
Secure authentication
-
Role-based access
-
Permission management
-
Data encryption
-
Secure database connections
-
Activity logging
-
Regular backups
-
Session management
Users should only be given access to information required for their role.
For example, an employee may be able to view their assigned tasks while a senior manager may have access to department-level reports.
Designing an Effective Management Dashboard
A dashboard should not attempt to display every available piece of information.
Too much information can make the interface difficult to understand.
An effective dashboard should focus on the most important metrics and provide a clear visual hierarchy.
Useful design principles include:
Keep It Simple
Display the information that users actually need.
Use Clear Visuals
Charts, graphs, tables, and status indicators should make information easier to understand.
Provide Filtering
Allow users to filter information by date, department, location, project, or other relevant criteria.
Highlight Important Changes
Use clear indicators for increases, decreases, delays, and exceptions.
Make It Responsive
The dashboard should work effectively across desktops, tablets, and other supported devices.
Connecting Multiple Business Systems
Many organizations already use several software platforms.
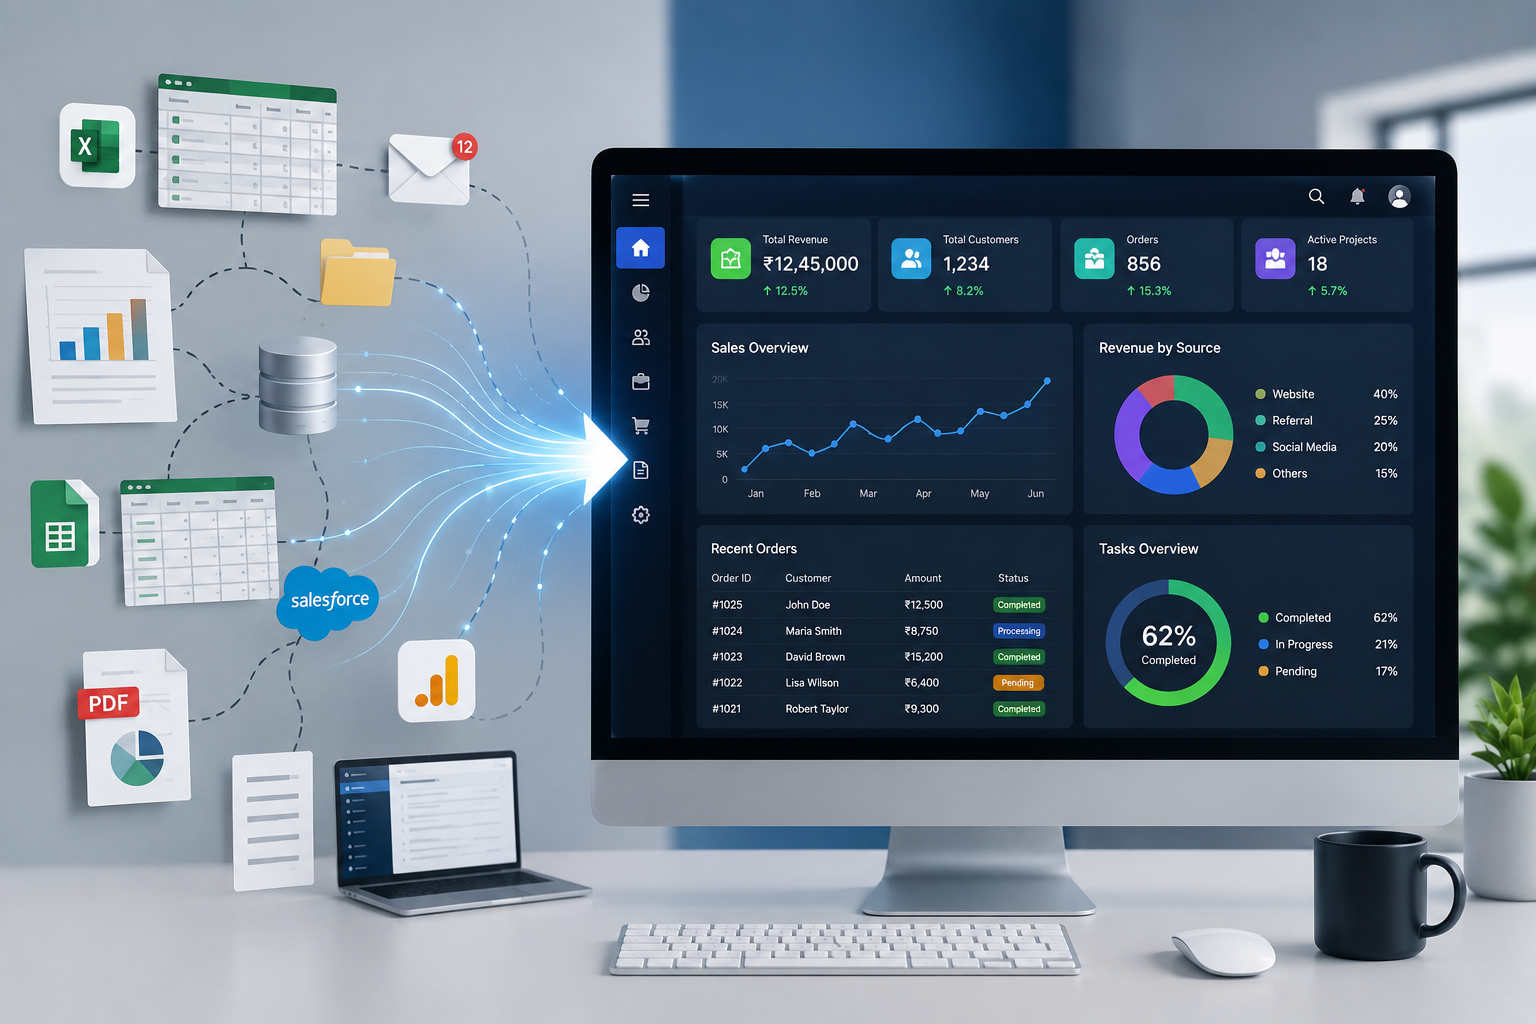
A management dashboard can connect relevant systems through APIs, databases, or integrations.
Possible data sources include:
-
CRM systems
-
ERP software
-
Accounting platforms
-
HR systems
-
Project management tools
-
Marketing platforms
-
Inventory systems
-
Website analytics
-
Internal databases
This allows management to view selected information without switching between multiple applications.
Management Dashboards for Growing Businesses
Small businesses may initially manage operations using spreadsheets and simple reports.
As the organization grows, however, manual reporting can become difficult to maintain.
More employees, customers, transactions, projects, and departments create additional data.
A management dashboard provides a scalable way to organize this information.
Businesses can start with a few important KPIs and gradually add new metrics, integrations, reports, and workflows as their requirements evolve.
Common Mistakes to Avoid
A dashboard can become ineffective if it is poorly designed.
Common mistakes include:
-
Displaying too many metrics
-
Using irrelevant KPIs
-
Relying on outdated data
-
Creating complicated navigation
-
Ignoring user roles
-
Not providing filters
-
Using unclear visualizations
-
Failing to secure sensitive information
The goal should always be clarity and usefulness.
How to Start Building a Management Dashboard
Businesses can approach dashboard development in several stages.
1. Identify business goals
Determine what management needs to monitor.
2. Select important KPIs
Choose metrics that directly support those goals.
3. Identify data sources
Determine where the required information currently exists.
4. Connect relevant systems
Use APIs, databases, or integrations where appropriate.
5. Design the dashboard
Create a simple interface based on user requirements.
6. Add permissions
Ensure users can only access appropriate information.
7. Test the system
Check data accuracy, performance, security, and usability.
8. Improve continuously
Use feedback from managers and employees to refine the dashboard.
Conclusion
Management dashboards have become an important part of modern digital business operations because they provide a structured way to understand complex business information.
By bringing important metrics, reports, project information, financial data, customer insights, and operational indicators into one interface, dashboards can improve visibility and support faster decision-making.
The most effective dashboard is not the one with the most charts or features. It is the one that presents the right information to the right people at the right time.
For growing businesses, a well-designed management dashboard can reduce manual reporting, improve operational visibility, support better resource management, and provide a stronger foundation for data-driven decision-making.